> ## Documentation Index
> Fetch the complete documentation index at: https://docs.bloxcord.net/llms.txt
> Use this file to discover all available pages before exploring further.
# Views
> Views turn your organization's data into answers. Build custom reports for any group of members, choose exactly what to display, and share them only with the people who need access. Every view is fully customizable, permission-controlled, and updates automatically as your data changes.
Views must be enabled before custom views can be displayed. Activity Quotas must also be enabled to generate quota views. Visit the Features tab to get started.
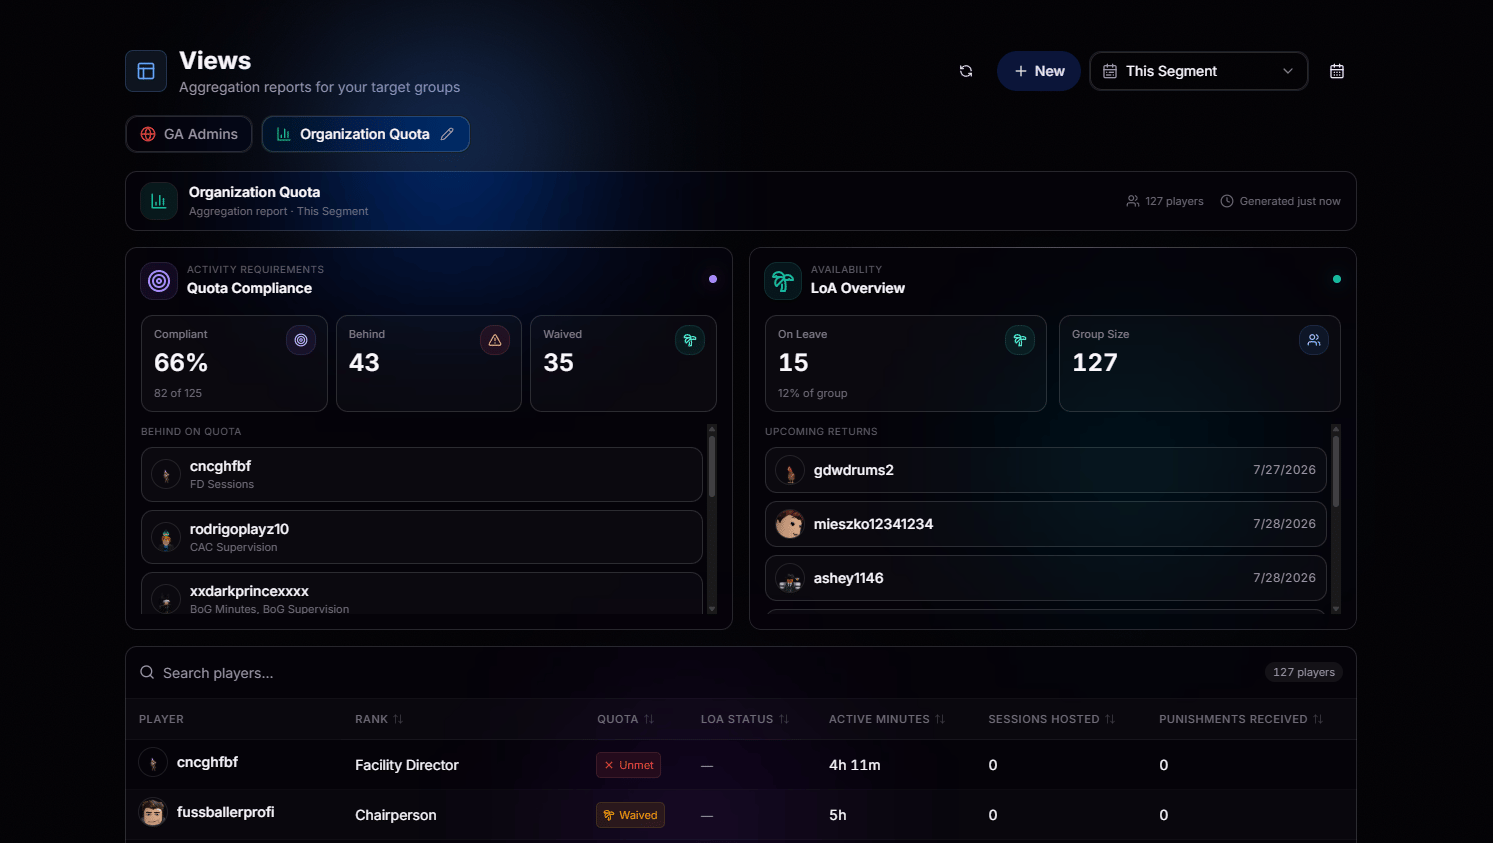 ## Anything You Want, For Whoever You Want
Every view is built around four simple decisions: who to include, which columns to display, which widgets to summarize the data, and who can access it. Create as many views as you need, switch between them in seconds, and get the insights you're looking for without digging through raw data.
Build reports for exactly the members you care about. Target a single rank, a range of ranks, a custom BloxCord role, or your entire organization.
Views only open for the people you explicitly allow. Sensitive reports stay invisible to everyone else, no exceptions.
Track compliance, activity, leave of absence status, sessions, punishments, and more across the entire group, all refreshed on demand.
The same view, different time periods. Instantly switch between the current segment, last segment, or a custom date range to compare trends over time.
## Configure Every Detail
Open **View settings** to shape a view exactly the way you want it. Four tabs, four areas of control.
### General
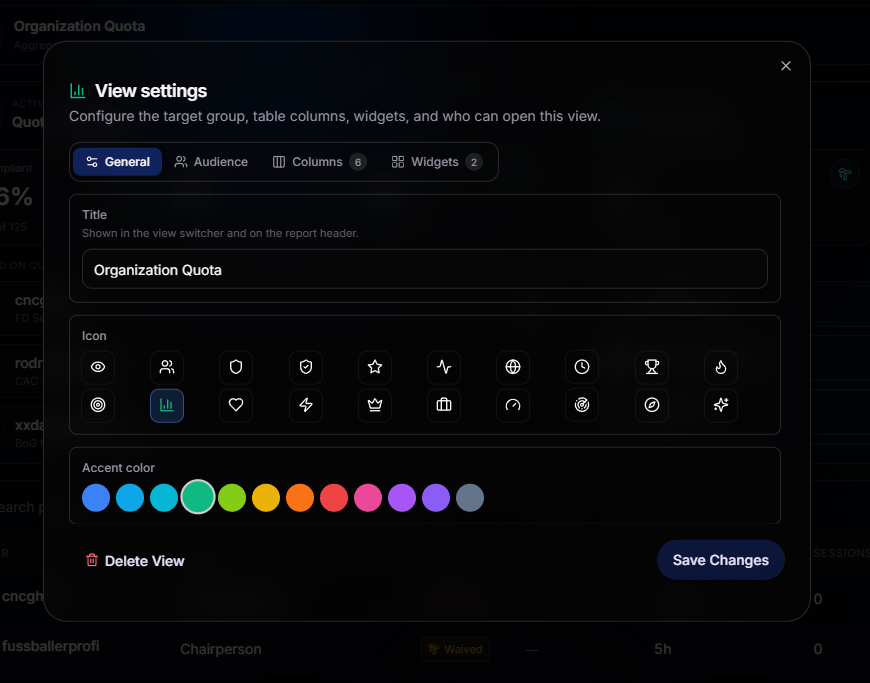
Name the view, pick an icon, and choose an accent color so it stands out in the switcher. Small touches that make your dashboard feel like yours.
## Anything You Want, For Whoever You Want
Every view is built around four simple decisions: who to include, which columns to display, which widgets to summarize the data, and who can access it. Create as many views as you need, switch between them in seconds, and get the insights you're looking for without digging through raw data.
Build reports for exactly the members you care about. Target a single rank, a range of ranks, a custom BloxCord role, or your entire organization.
Views only open for the people you explicitly allow. Sensitive reports stay invisible to everyone else, no exceptions.
Track compliance, activity, leave of absence status, sessions, punishments, and more across the entire group, all refreshed on demand.
The same view, different time periods. Instantly switch between the current segment, last segment, or a custom date range to compare trends over time.
## Configure Every Detail
Open **View settings** to shape a view exactly the way you want it. Four tabs, four areas of control.
### General
Name the view, pick an icon, and choose an accent color so it stands out in the switcher. Small touches that make your dashboard feel like yours.
 ### Audience
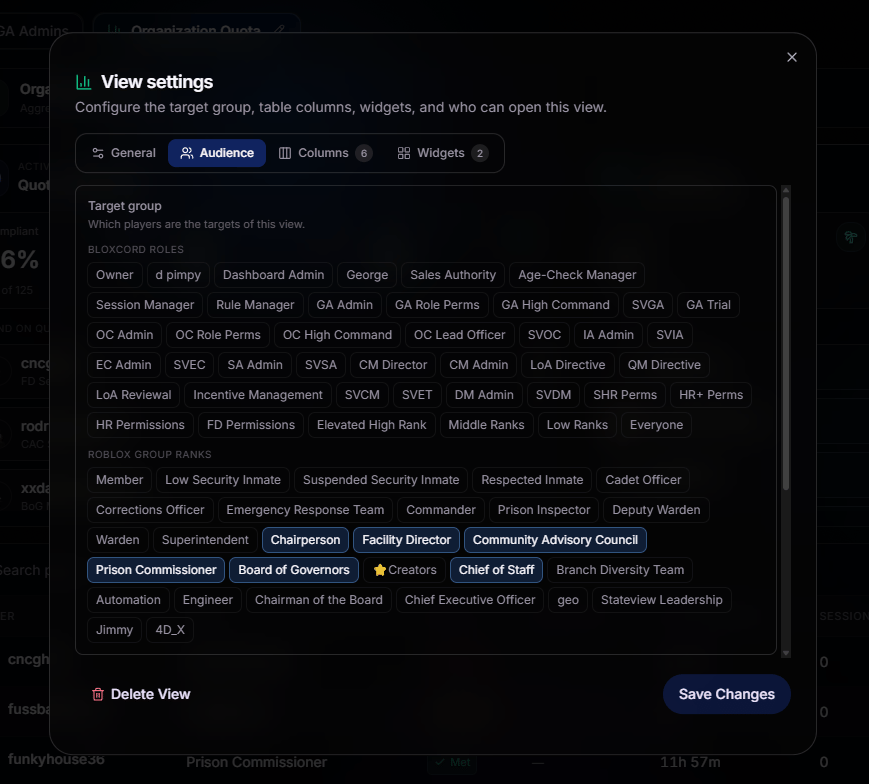
**Choose exactly who belongs in the report**. Combine BloxCord roles with Roblox group ranks, from Member all the way to Owner, and every matching member is included automatically.
### Audience
**Choose exactly who belongs in the report**. Combine BloxCord roles with Roblox group ranks, from Member all the way to Owner, and every matching member is included automatically.
 ### Columns
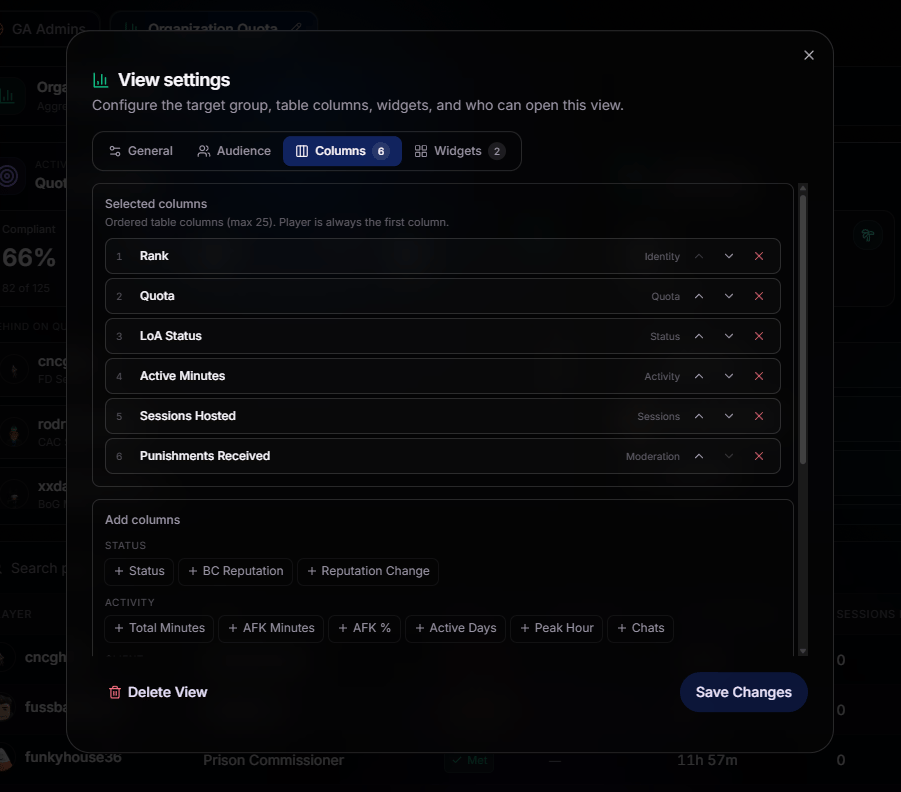
Build a table that fits your workflow. Choose up to 25 columns, arrange them in any order, and pull from categories like Identity, Status, Activity, Sessions, Moderation, and more.
### Columns
Build a table that fits your workflow. Choose up to 25 columns, arrange them in any order, and pull from categories like Identity, Status, Activity, Sessions, Moderation, and more.
 ### Widgets
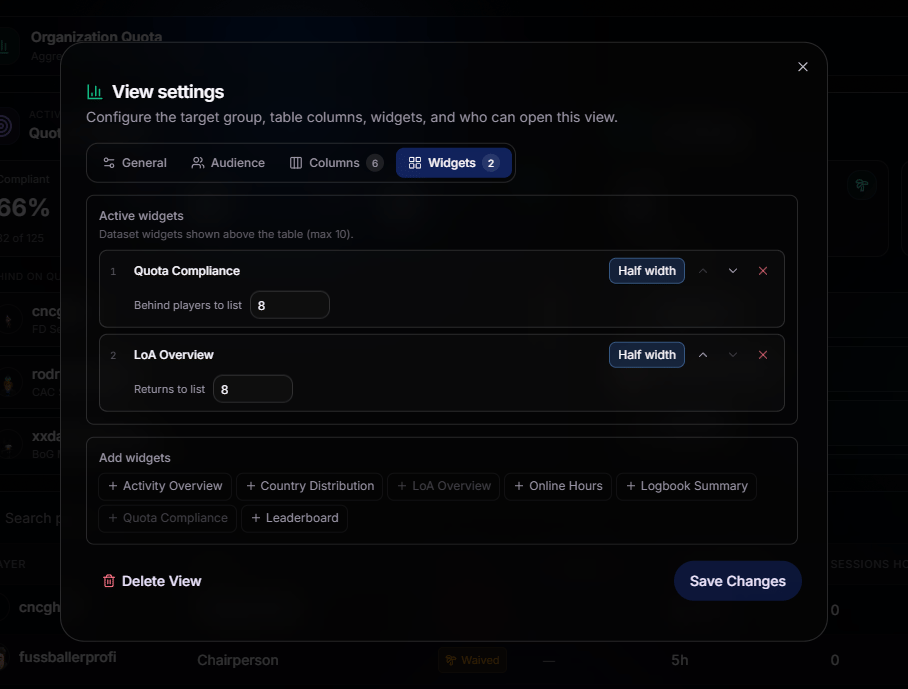
Summarize your data before you dive into the details. Add up to 10 widgets above the table, including Quota Compliance, Leave of Absence Overview, Activity Overview, Country Distribution, Online Hours, Logbook Summary, Leaderboard, and more. Resize each widget to show as much or as little detail as you need by clicking the width.
### Widgets
Summarize your data before you dive into the details. Add up to 10 widgets above the table, including Quota Compliance, Leave of Absence Overview, Activity Overview, Country Distribution, Online Hours, Logbook Summary, Leaderboard, and more. Resize each widget to show as much or as little detail as you need by clicking the width.
 ## Deep Dives, Not Data Dumps
Every view is designed to answer real questions fast:
See every member behind the numbers. Ready to click into.
The LoA Overview shows current absences and upcoming return dates for the whole group.
Sort by active minutes, sessions hosted, or peak hour to surface your highest performers instantly.
No two organizations work the same way, and your reports shouldn't either. Build as many views as you need, customize every detail, and create reports that answer the questions your team actually asks.
## Deep Dives, Not Data Dumps
Every view is designed to answer real questions fast:
See every member behind the numbers. Ready to click into.
The LoA Overview shows current absences and upcoming return dates for the whole group.
Sort by active minutes, sessions hosted, or peak hour to surface your highest performers instantly.
No two organizations work the same way, and your reports shouldn't either. Build as many views as you need, customize every detail, and create reports that answer the questions your team actually asks.